Warning
About this backtest
The figures shown are the founder's own private strategy (the "Smart Momentum Grid"), shown only to illustrate what the software does. They are historical and hypothetical, not for sale, not a recommendation, and not representative of typical or expected results. TradingTune is a backtesting and optimization tool, not financial advice. Nothing here is a recommendation, solicitation, or offer to buy, sell, or hold any security, or to adopt any trading strategy. Trading carries risk of loss.
Smart Momentum Grid v1 · Bitstamp
BTC backtest: Bitcoin
The Smart Momentum Grid v1 strategy (the founder's own private strategy), optimized with TradingTune and compared against buy-and-hold on historical data over 2024 to 2026.
- Net profit (historical)
- +302.24%
- Buy & hold
- +129.68%
Straight from TradingView
The chart, equity curve, benchmarking, returns, and trade analysis, exactly as the strategy tester reports them. Click any view to enlarge.
Chart · click to enlarge
Strategy compared with buy and hold
| Metric | Strategy | Buy & hold |
|---|---|---|
| Net profit | +302.24% | +129.68% |
| Win rate | 100% | n/a |
| Losing trades | 0 | n/a |
| Sharpe ratio | 0.26 | n/a |
| Sortino ratio | 19.36 | n/a |
| Total trades | 25 | 1 |
Why the win rate is 100 percent
Smart Momentum Grid v1 is a grid strategy that runs without stop losses: it scales into a position and closes a trade only once it is back in profit, so every closed trade is a win and there are zero losing trades. That is a property of the design, not a promise of a flawless edge. The real risk shows up as drawdown and open exposure, not as losing trades, which is exactly why a 100 percent win rate is a flag to investigate . Judge a run like this by its drawdown and trade count: see the common backtesting mistakes .
Hypothetical, historical results shown for illustration. Past performance does not guarantee future results. See our terms for the full disclaimer.
These settings were found with Bayesian (TPE) optimization. Explore all seven optimization methods to see how each one searches your parameter space.
More backtests
-
 NASDAQ
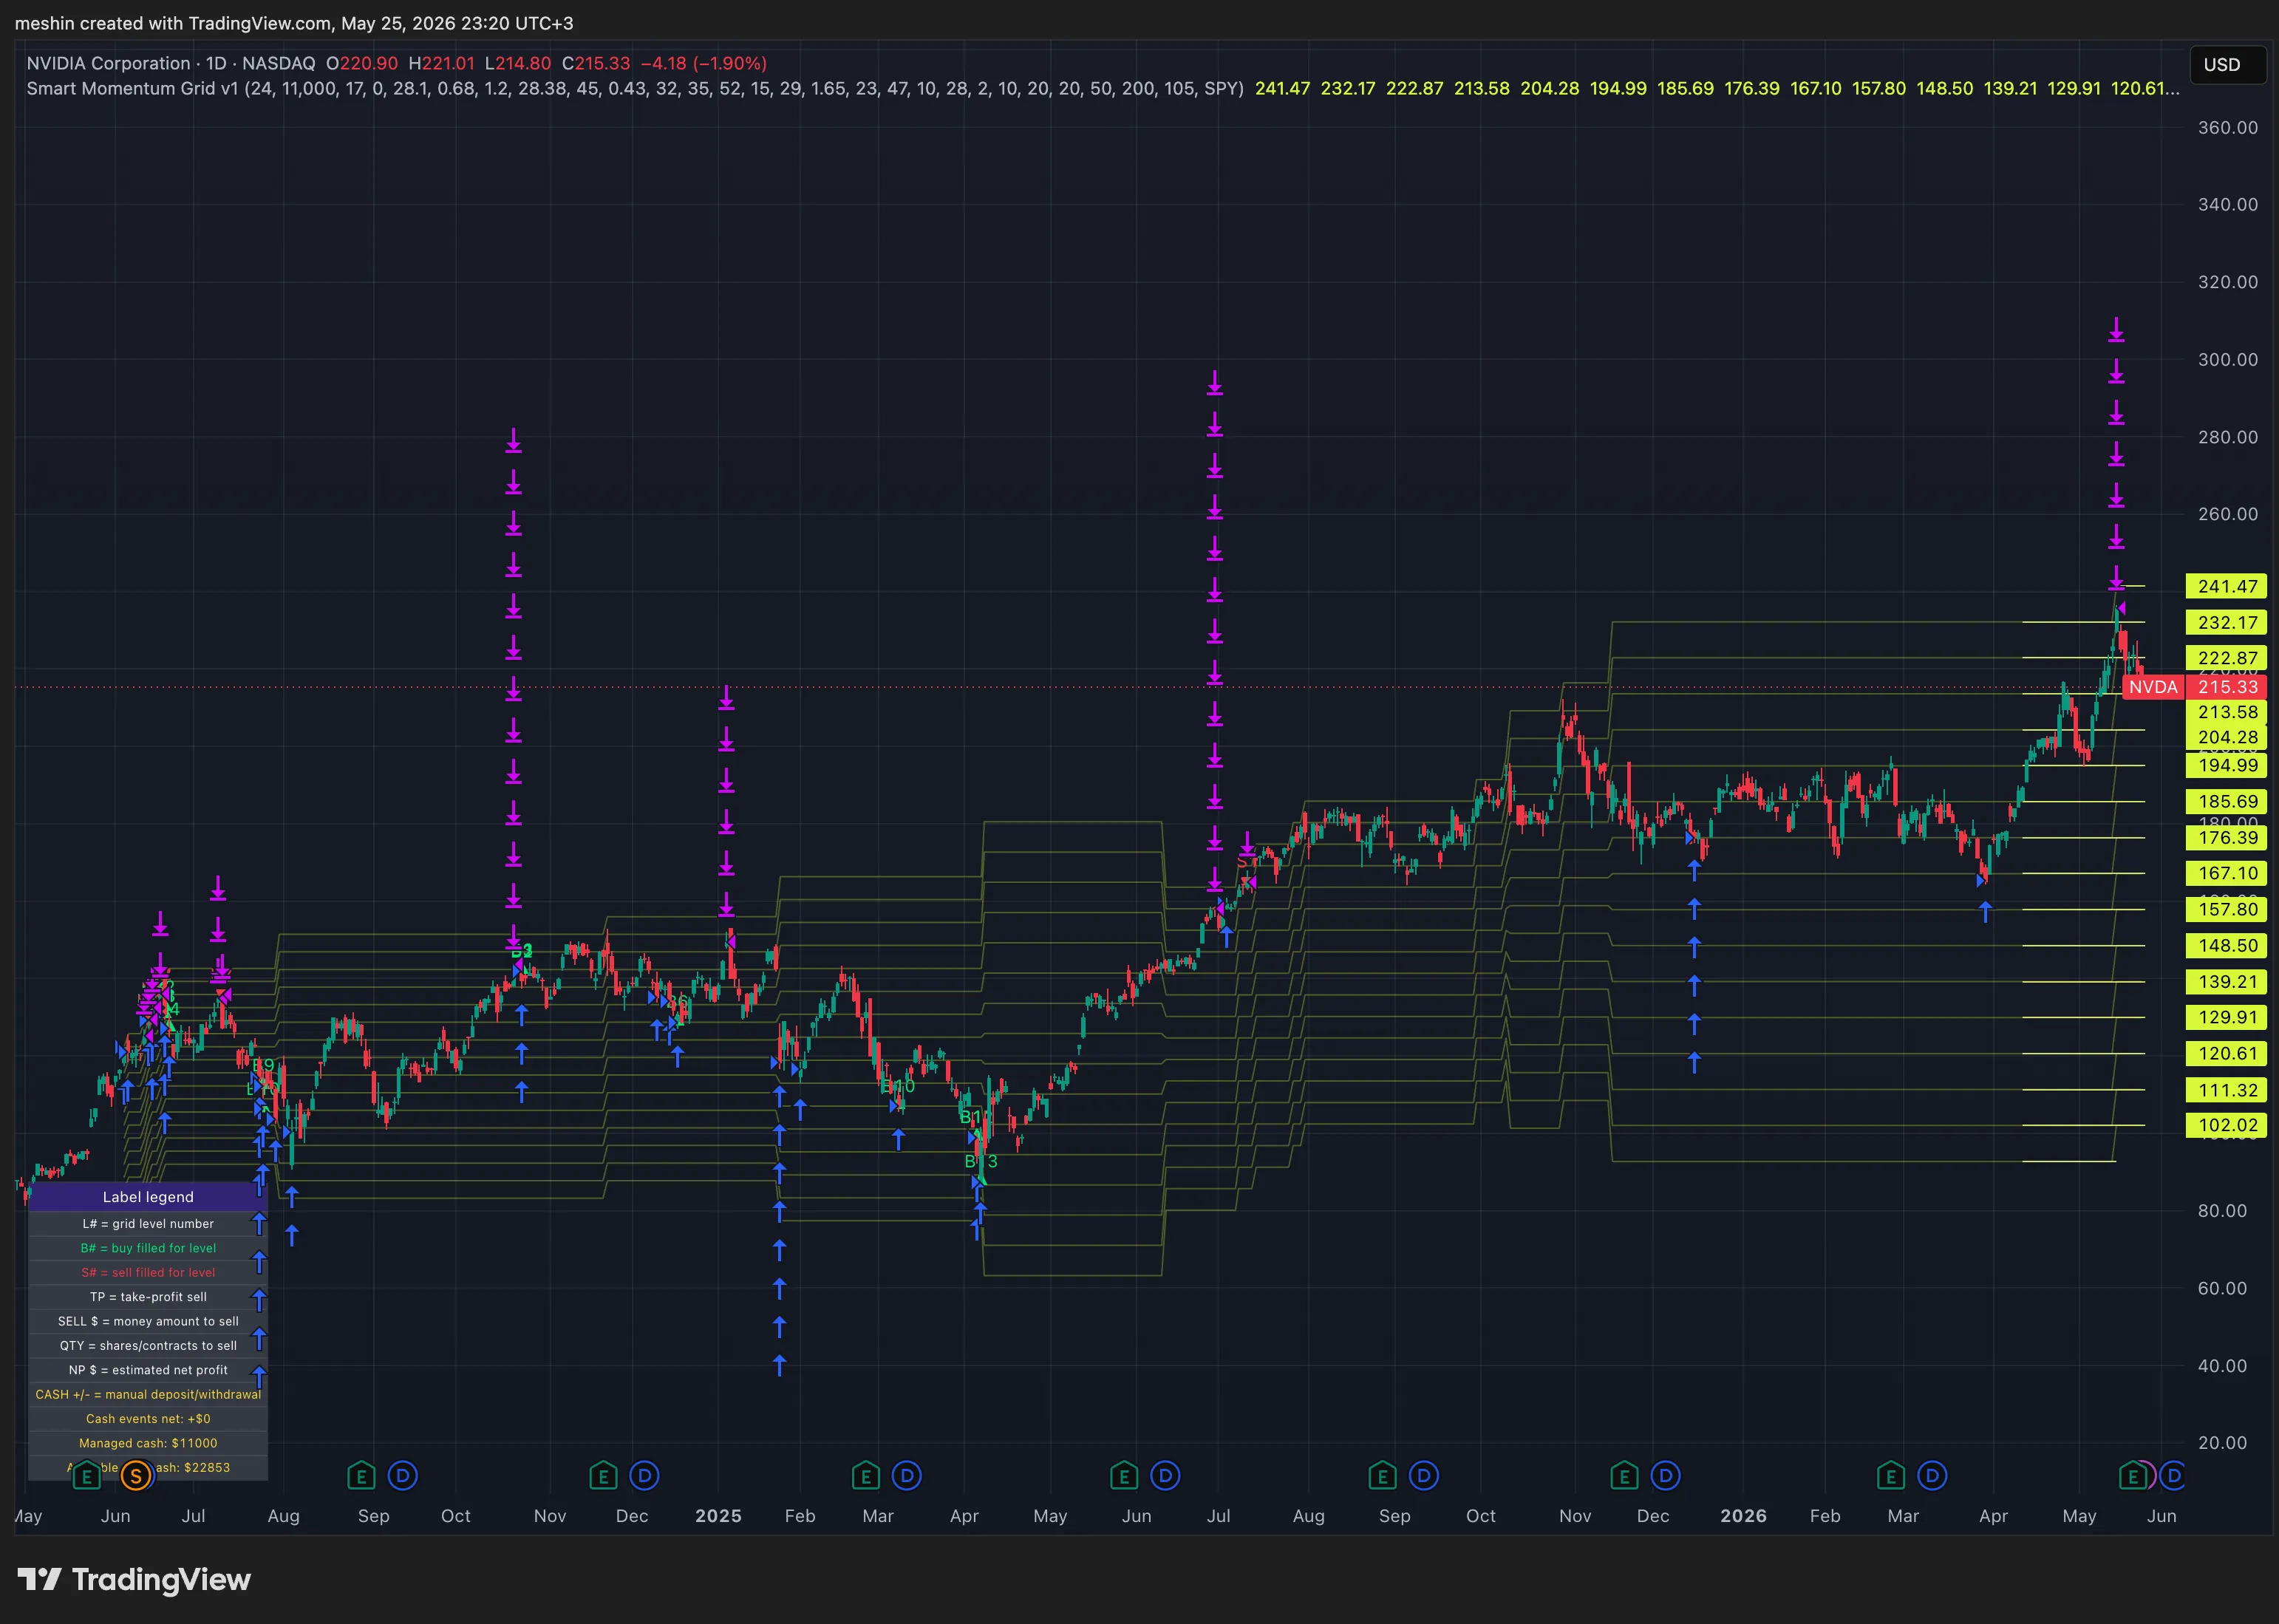
NVDA
NVIDIA Corporation
Net profit (historical)
+143.40%
Buy & hold
+84.10%
1.71x vs buy & hold (historical) View backtest -
 NASDAQ
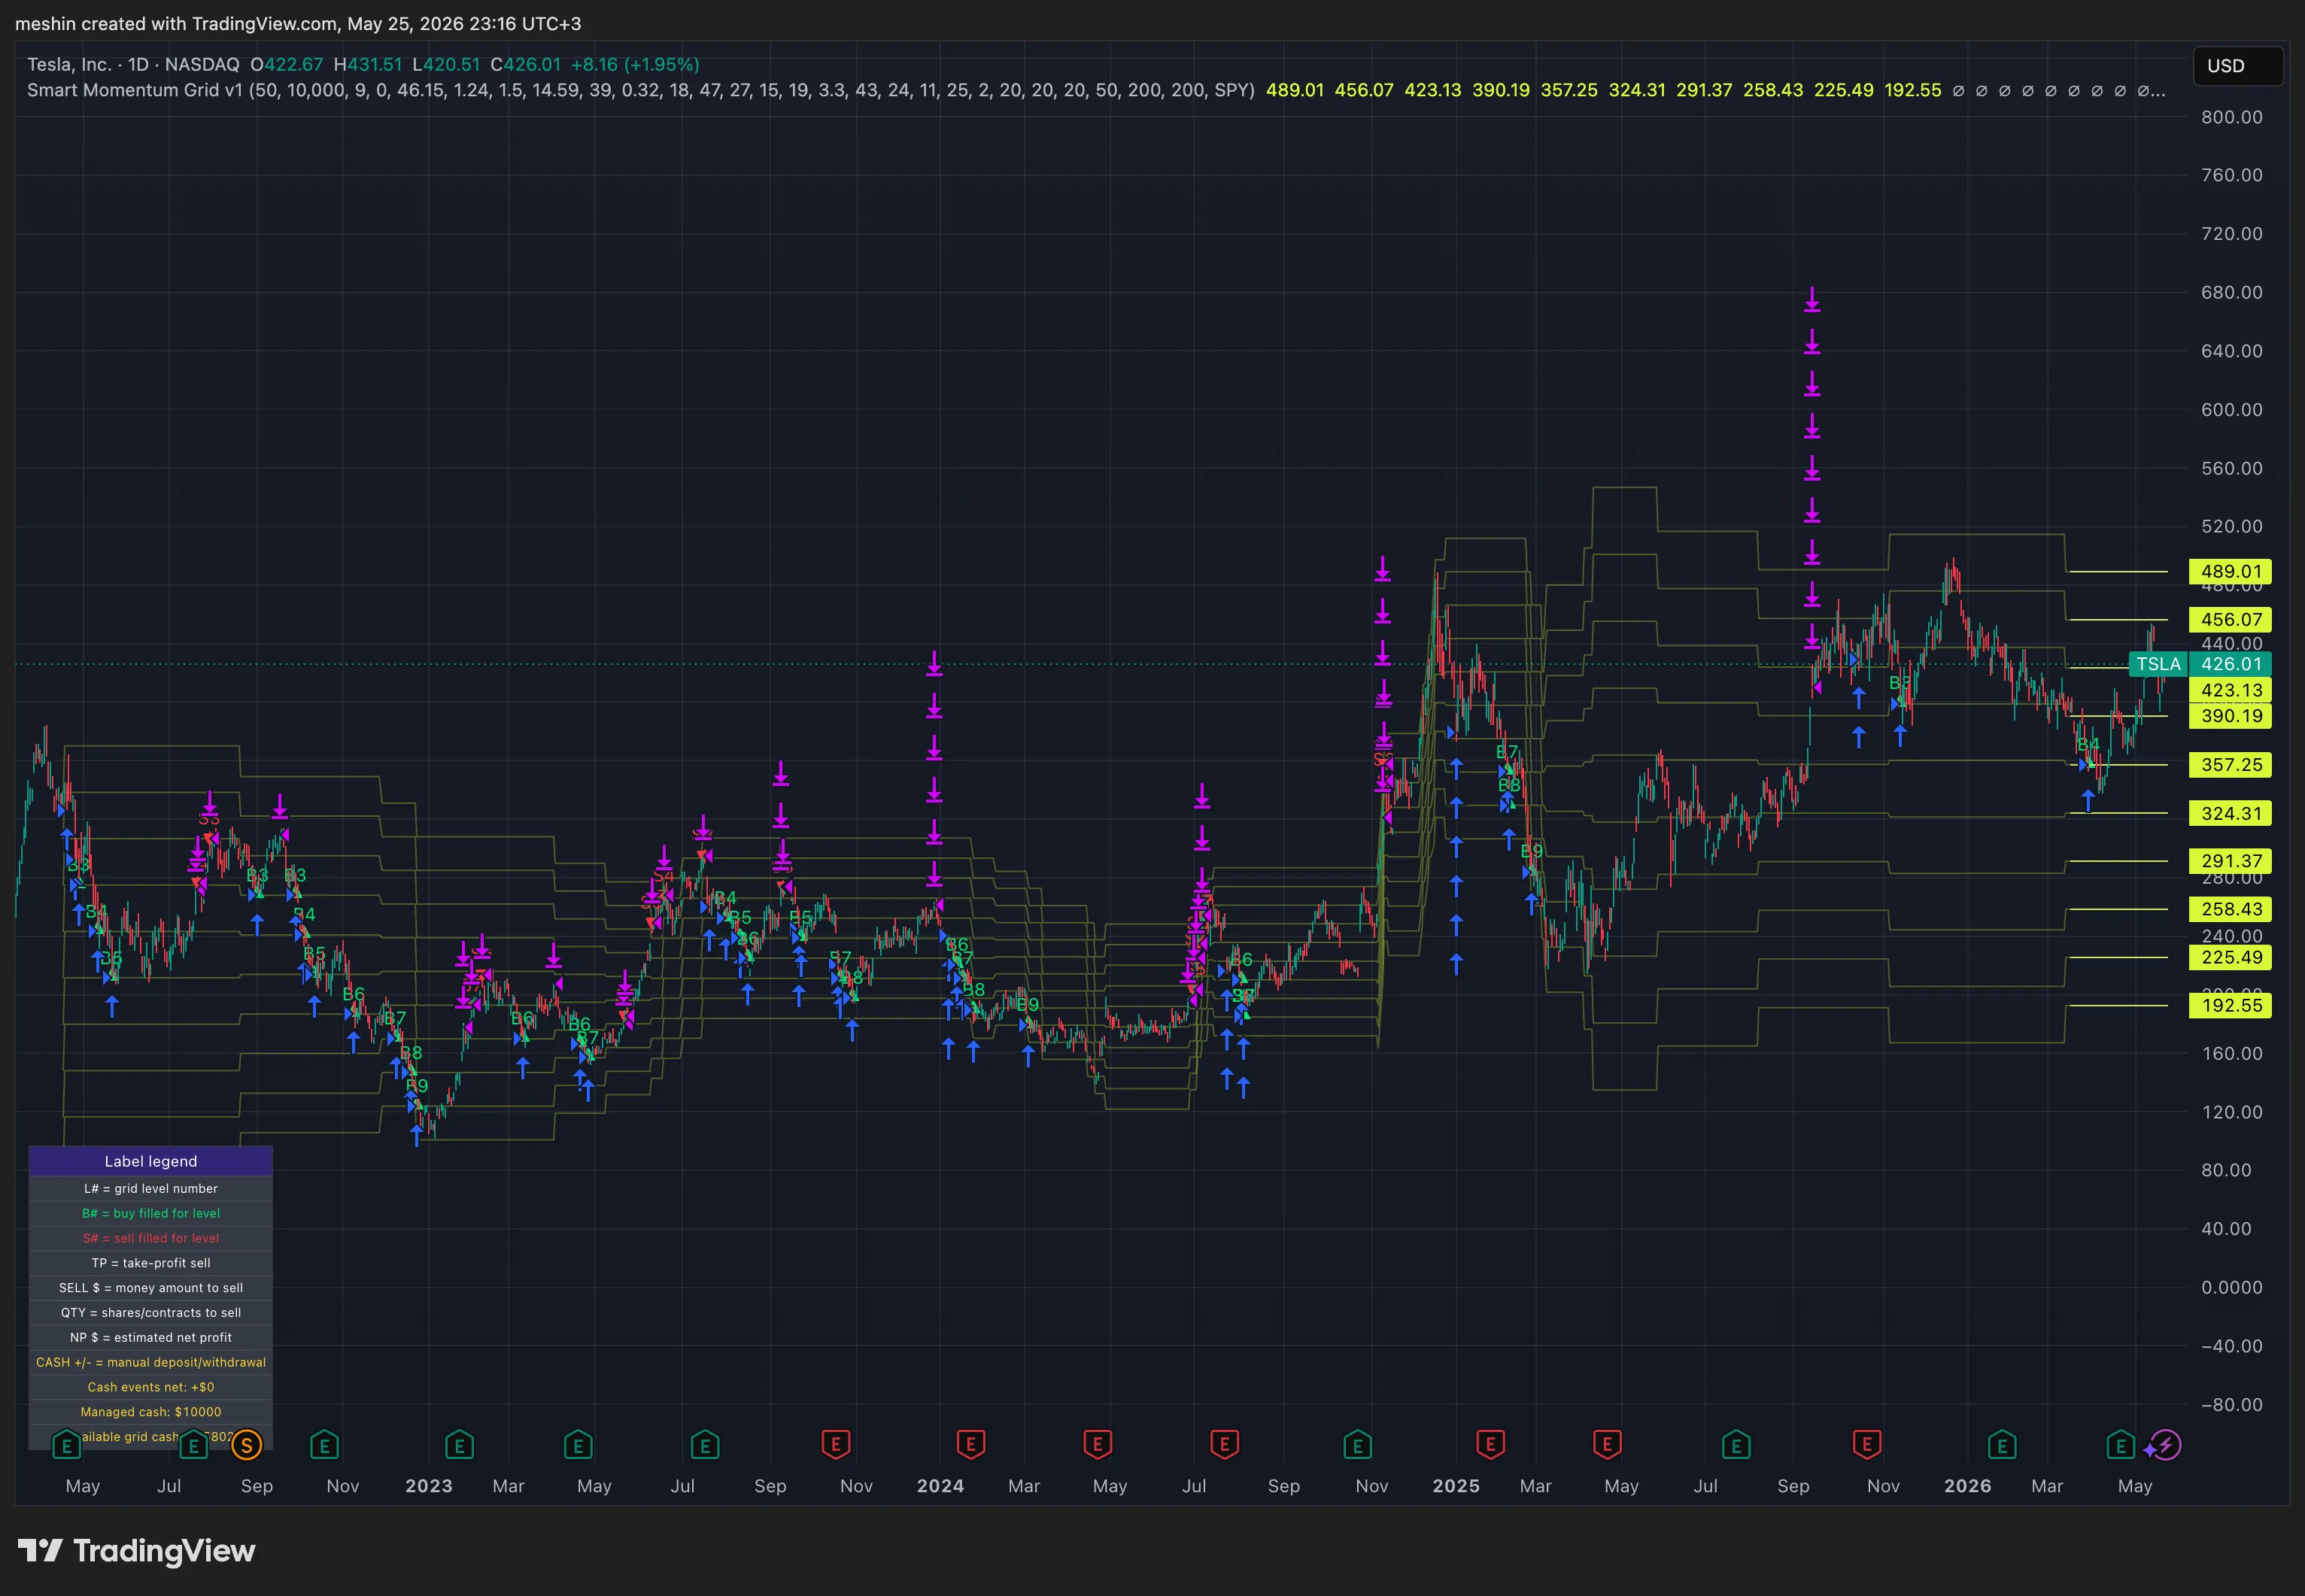
TSLA
Tesla, Inc.
Net profit (historical)
+174.53%
Buy & hold
+100.81%
1.73x vs buy & hold (historical) View backtest -
 NASDAQ
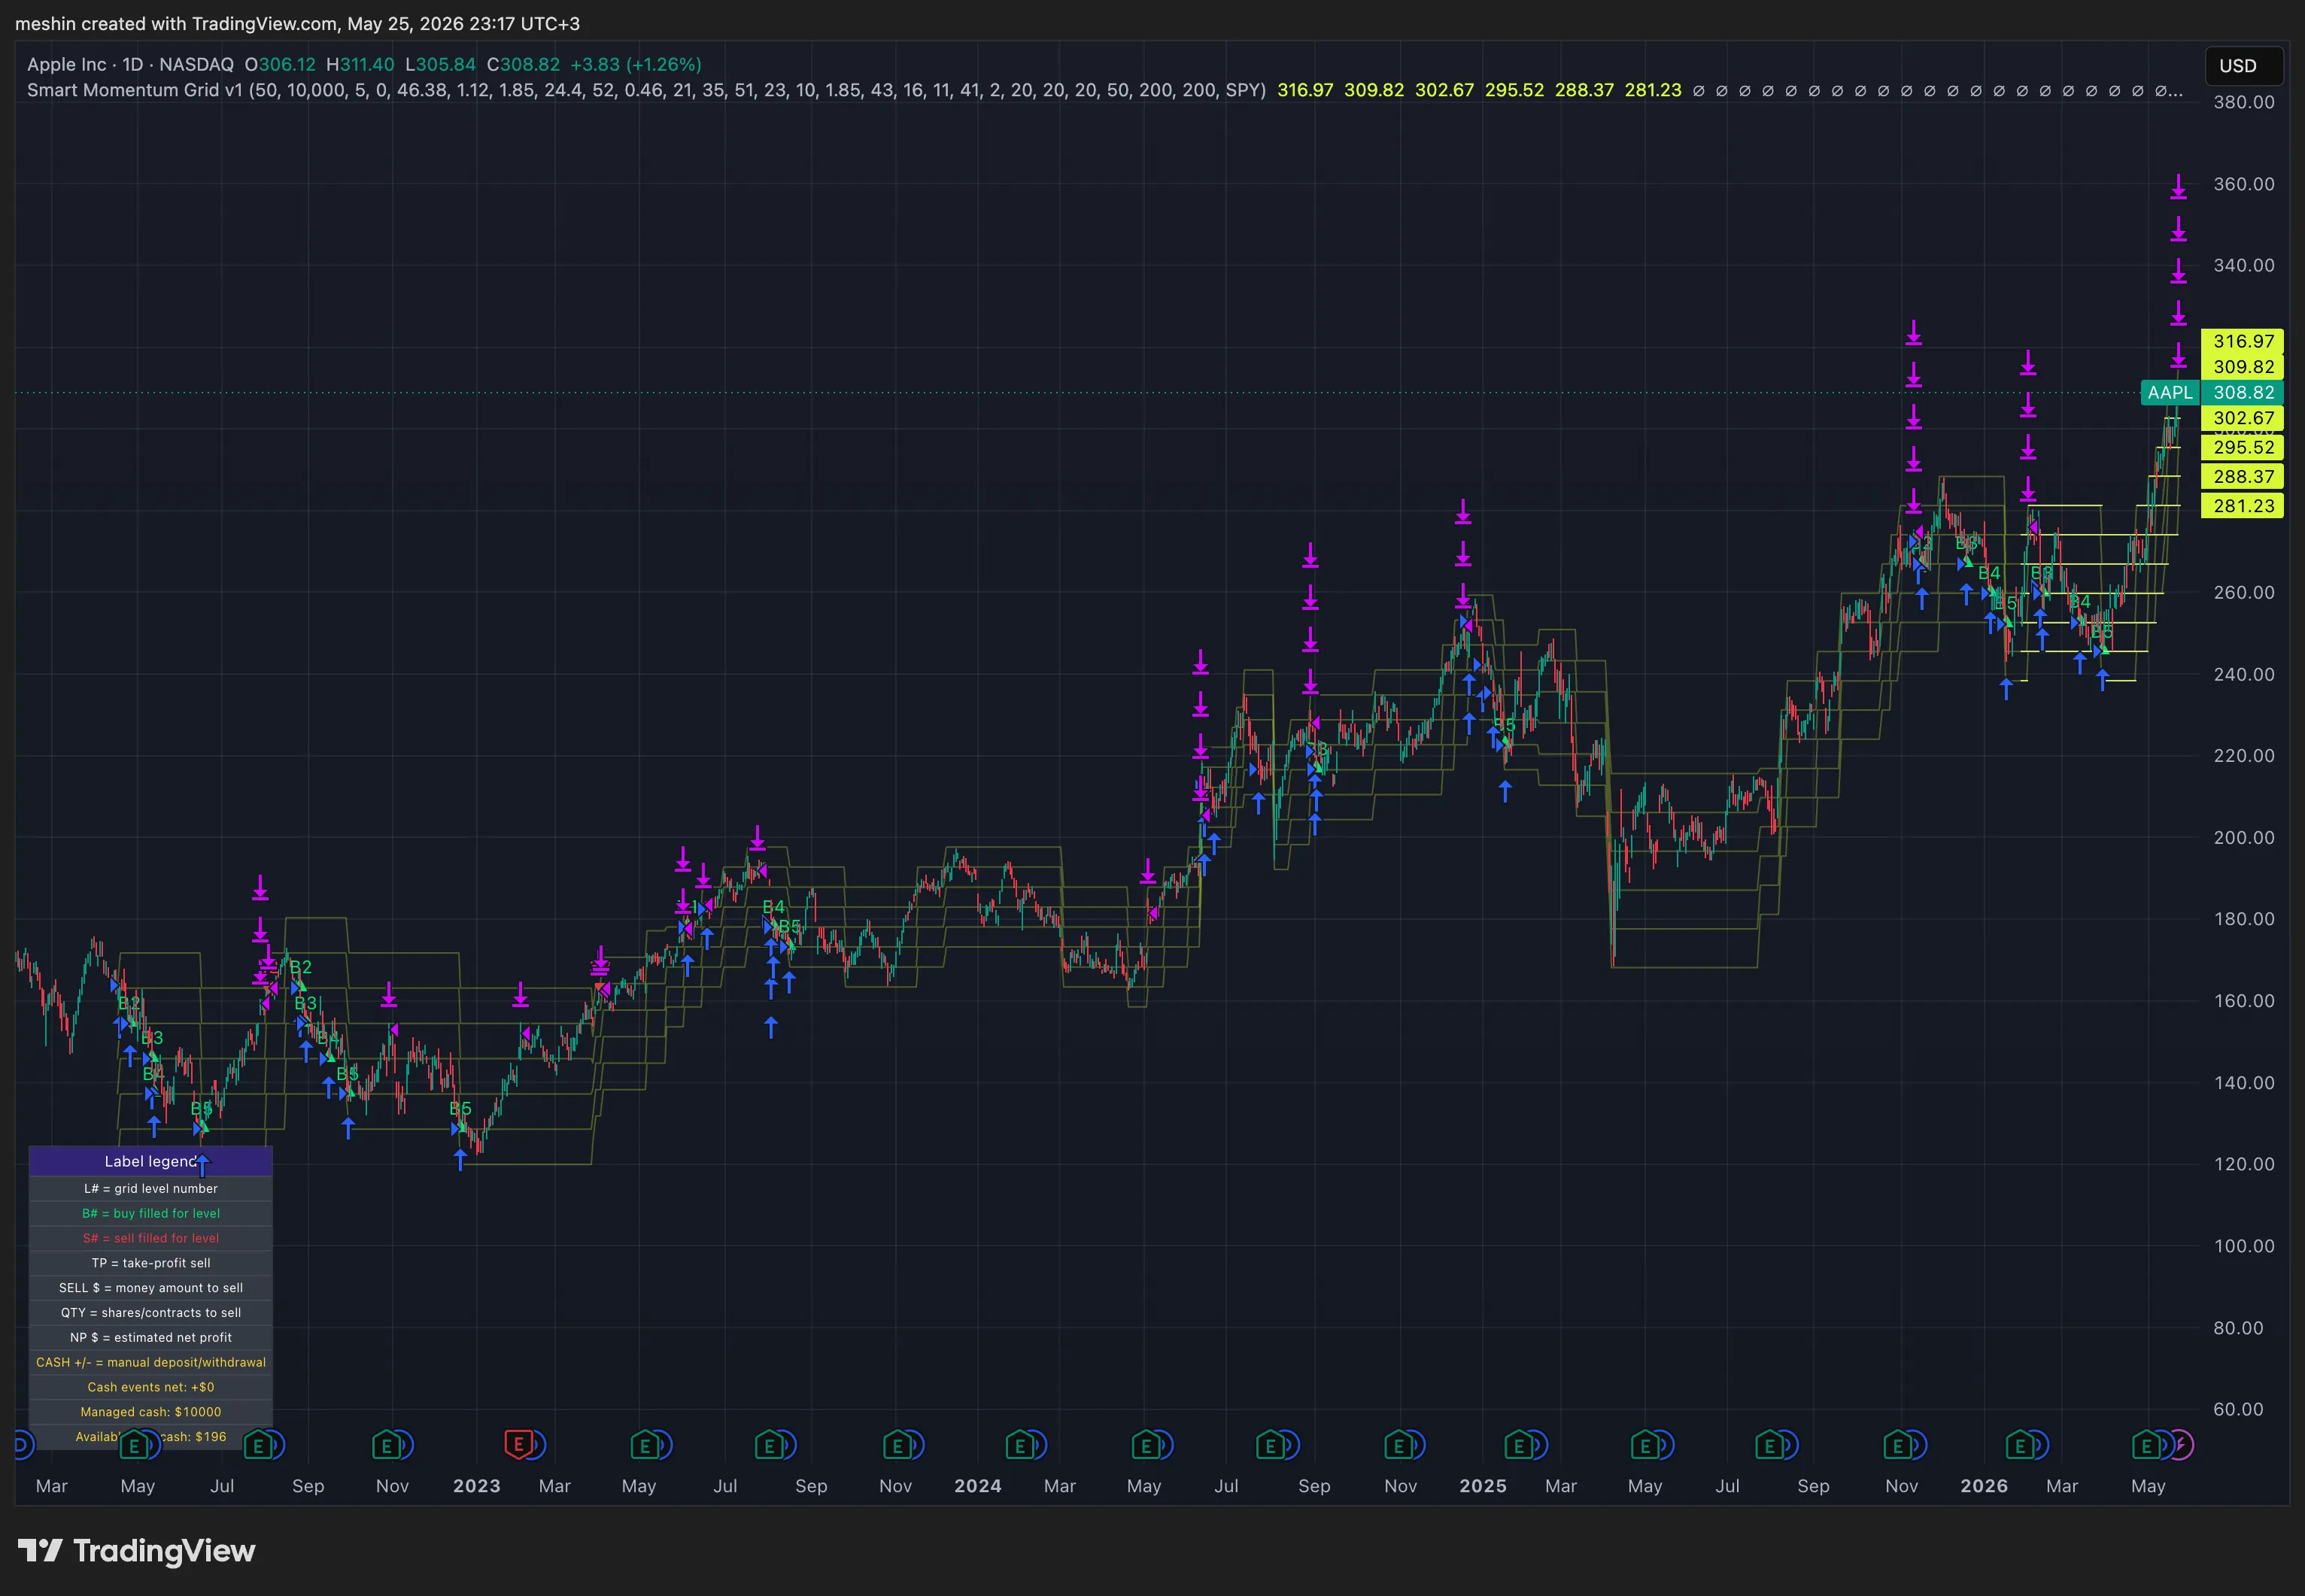
AAPL
Apple Inc.
Net profit (historical)
+133.34%
Buy & hold
+110.84%
1.20x vs buy & hold (historical) View backtest